


Stock charts for beginners are a tool that provides the easiest way to understand the stock market! They will help you learn about the stock market. If you are a new investor or just curious about the stock market, stock charts make your journey simple. These charts show how the price of a stock goes up and down over time and helps you understand market trends. So come, learn stock chart basics and how to read them. Looking for stock charts will make you a confident investor without getting entangled in complicated financial terms. In this blog, we will explain stock charts for beginners in a very easy way so that you can understand the trends like a pro. Thinking of starting to invest? Let’s see why stock charts are important and how to read stock charts.
Understanding stock charts is like reading a map! They show price (vertical axis) and time (horizontal axis), along with volume bars that indicate trading activity. For beginners, start with line charts or try candlestick charts for better insights. Candlesticks show the opening, closing, high, and low prices, which help spot bullish (price up) or bearish (price down) trends. The first step in reading stock charts is looking for trends—uptrend (higher highs) or downtrend (lower lows)—and checking volume to confirm price moves. For example, if the price is rising and volume is high, it means buyers are active.
Start practicing with free tools like TradingView or the Grow app. Choose a stock, watch its chart daily, and note patterns like support (where the price stops) or resistance (where the price struggles). Focus on simple patterns in the beginning, avoiding complicated things. After a little practice, stock charts for beginners will seem very easy. Be patient, focus on one stock, and soon you will be able to confidently understand market trends, and your investing journey will start to become easier.
What Are Stock Charts for Beginners?
Stock charts for beginners are a visual tool that shows stock price movements over time, helping new investors understand market behavior. These charts show data such as opening, closing, high, and low prices, helping us spot trends and make smart decisions more easily. For beginners, learning the basics of stock charts is important to see patterns such as uptrends or downtrends and predict future prices. They simplify complex market data, highlighting opportunities and risks. Common types include line charts, which show closing prices over time, and candlestick charts, which show detailed price action (open, close, high, low) in a ‘candle.’ By learning stock charts for beginners, you can build a strong base of technical analysis and improve trading strategies
Why Stock Charts Matter for Beginner Investors
Stock charts for beginners are crucial tools that visually display a stock’s price movements over time, helping new investors understand market trends. By learning to read these charts, beginners can spot patterns like uptrends or downtrends, making informed trading decisions. Learning stock chart basics simplifies complex data, identifies opportunities, and manages risks effectively. Common charts, like line charts for closing prices or candlestick charts for detailed price action, provide clear insights. For beginners, mastering stock charts builds a strong foundation for technical analysis, boosting confidence and improving investment strategies in the dynamic stock market.
Key Components of Stock Charts for Beginners
Stock charts for beginners are a powerful tool that visually shows a stock’s price movements, which helps new investors understand the market. It’s important to find the key components of these charts. First, the price axis (y-axis), which represents the stock’s price levels (open, close, high, low). Second, the time axis (x-axis), which plots the data by day, week, or month. Candlestick charts and line charts are common types—candlesticks show detailed price action, while line charts show only closing prices. Volume bars are lower, which indicates trading activity—more volume means stronger price movement. Indicators such as moving averages or RSI also help to understand trends and momentum. Learning stock chart basics helps beginners spot patterns such as support, resistance, and breakouts. By understanding these components, you can predict market behavior. Learning stock charts for beginners strengthens technical analysis, which helps to make trading decisions confidently and strategically. Regular practice and chart analysis help you improve your investing skills and understand the dynamic nature of the market better.
Understanding Price and Time Axes


Price and time axes are core elements in stock charts for beginners.s. The price axis (y-axis) shows the stock’s price levels—such as open, close, high, and low—which helps to understand the market’s up-and-down movements. The time axis (x-axis) plots data against a period of time, such as a day, week, or month. “Learn stock chart basics” explains how the combination of price and time reveals trends and patterns, such as uptrends or downtrends. By learning stock charts for beginners, you can analyze market behavior through these axes and make smart trading decisions.
The Role of Volume in Stock Charts
Here we are talking about volume in stock charts for beginners, which is a key indicator that shows trading activity. Volume bars are located below the chart, which tell how many shares were traded at a time. High volume confirms strong price movements, while low volume shows weak trends. Learning stock chart basics helps you understand how volume works with price changes—for example, high volume gives validity during a breakout or reversal. By understanding volume in stock charts for beginners, you can judge market momentum and reliability, which leads to better trading decisions.
How to Read Stock Charts for Beginners: Step-by-Step Guide
Here we see that stock charts are a powerful tool for beginners to understand market price movements. Follow this step-by-step guide to learn stock chart basics:
1. Choose Chart Type: Select line charts (closing prices) or candlestick charts (open, close, high, low). Candlesticks provide more detail.
2. Understand Axes: The price axis (y-axis) shows stock price levels, and the time axis (x-axis) plots the data against time.
3. Check Volume: The volume bars at the bottom of the chart indicate trading activity—high volume confirms strong moves.
4. Identify Patterns: Spot uptrends (rising prices) or downtrends (falling prices). Look for support and resistance levels as well.
5. Use Indicators: Tools like moving averages or RSI help you understand trends and momentum.
By learning stock charts for beginners, you can get an idea of the market’s behavior. Regular practice makes patterns and signals clear, allowing you to make confident and strategic trading decisions. Start simple, and gradually seek advanced analysis.
Choosing the Right Chart Type for Beginners
Choosing the right chart type is important for stock charts for beginners. Common types include line charts and candlestick charts. Line charts are simple, showing only closing prices, which makes it easier for beginners to understand. Candlestick charts are more detailed, showing the open, close, high, and low prices in a single “candle,” making the price action clear. Learn stock chart basics to understand why candlesticks are better at spotting patterns, such as a doji or hammer. For beginners in stock charts, try line charts initially, then seek out candlestick charts to better understand market trends and trading opportunities.
Spotting Trends in Stock Charts for Beginners
Stock charts are the best way to spot trends for beginners. Trends such as uptrends (prices continuously rising) or downtrends (prices falling) indicate market direction. Learning stock chart basics means looking at candlestick patterns and price movements—such as higher highs and higher lows, which indicate an uptrend. Check the volume too; high volume confirms the strength of the trend. Look for support (stopping prices from falling) and resistance (stopping prices from rising) levels as well. By identifying trends through regular practice with stock charts for beginners, you can improve your trading decisions and take advantage of market opportunities
ALSO READ; https://phelikiran.com/expert-stock-picks-march-2025/
Common Patterns in Stock Charts for Beginners

Stock charts for beginners are important for understanding market trends and price movements. Learn stock chart basics to help you identify common patterns that aid in making trading decisions. Let’s look at some top popular patterns:
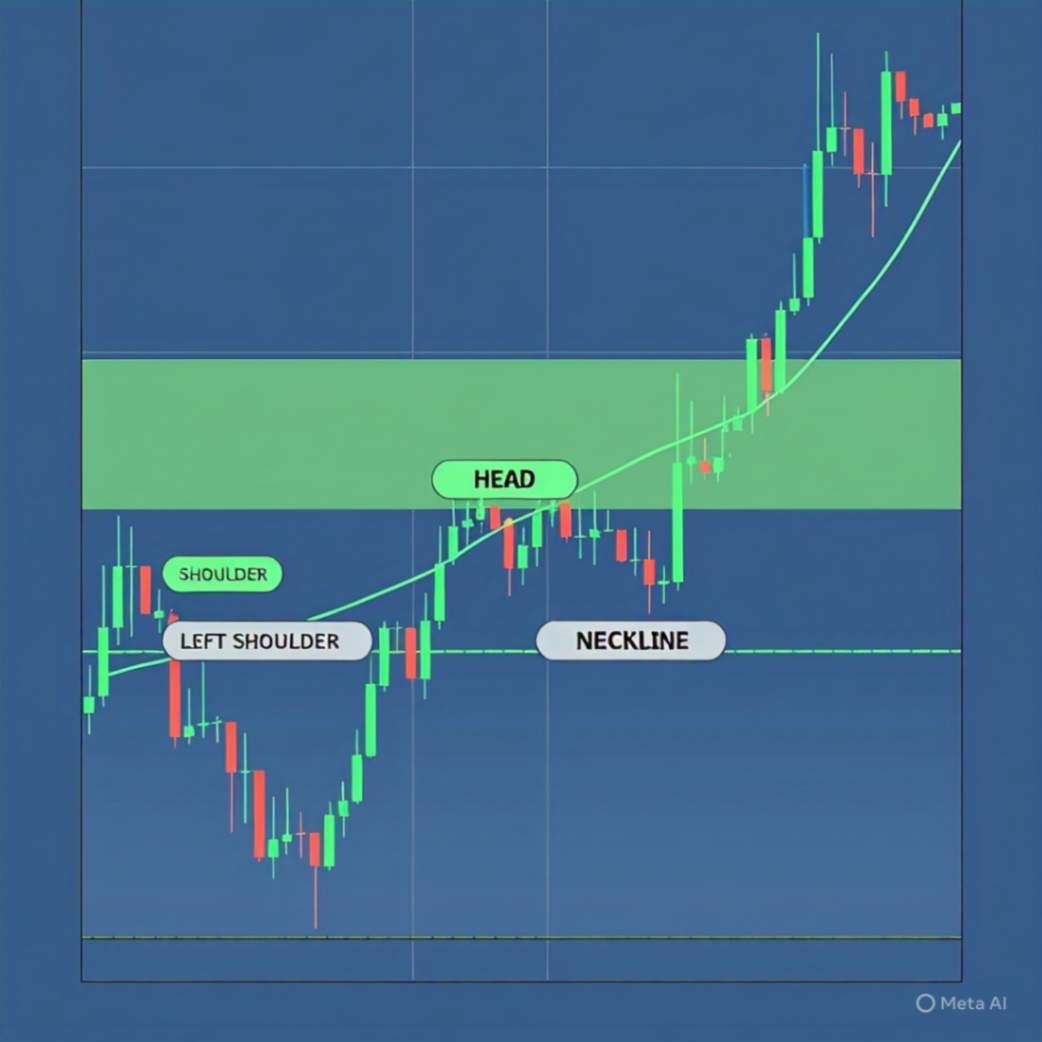
1. Head and Shoulders: This is a reversal pattern that indicates the end of an uptrend or downtrend. It forms one high (head) and two smaller highs (shoulders).
2. Double Top/Bottom: A double top (M shape) signals a downtrend, while a double bottom (W shape) indicates an uptrend.
3. Triangles: Ascending, descending, or symmetrical triangles indicate consolidation that occurs before a breakout.
4. Flags/Pennants: These are continuation patterns that show a small consolidation after a strong price movement.
Use candlestick charts and volume to understand these patterns—high volume confirms a breakout or reversal. For beginners, look for support (levels stopping prices from falling) and resistance (levels stopping prices from rising) in stock charts. These patterns become clear with practice. Focus on simple patterns initially, such as triangles, and gradually look for complex patterns. Learn stock chart basics along with regular chart analysis, which helps you understand market behavior better and make confident trading decisions, improving your investing skills.
Support and Resistance Levels
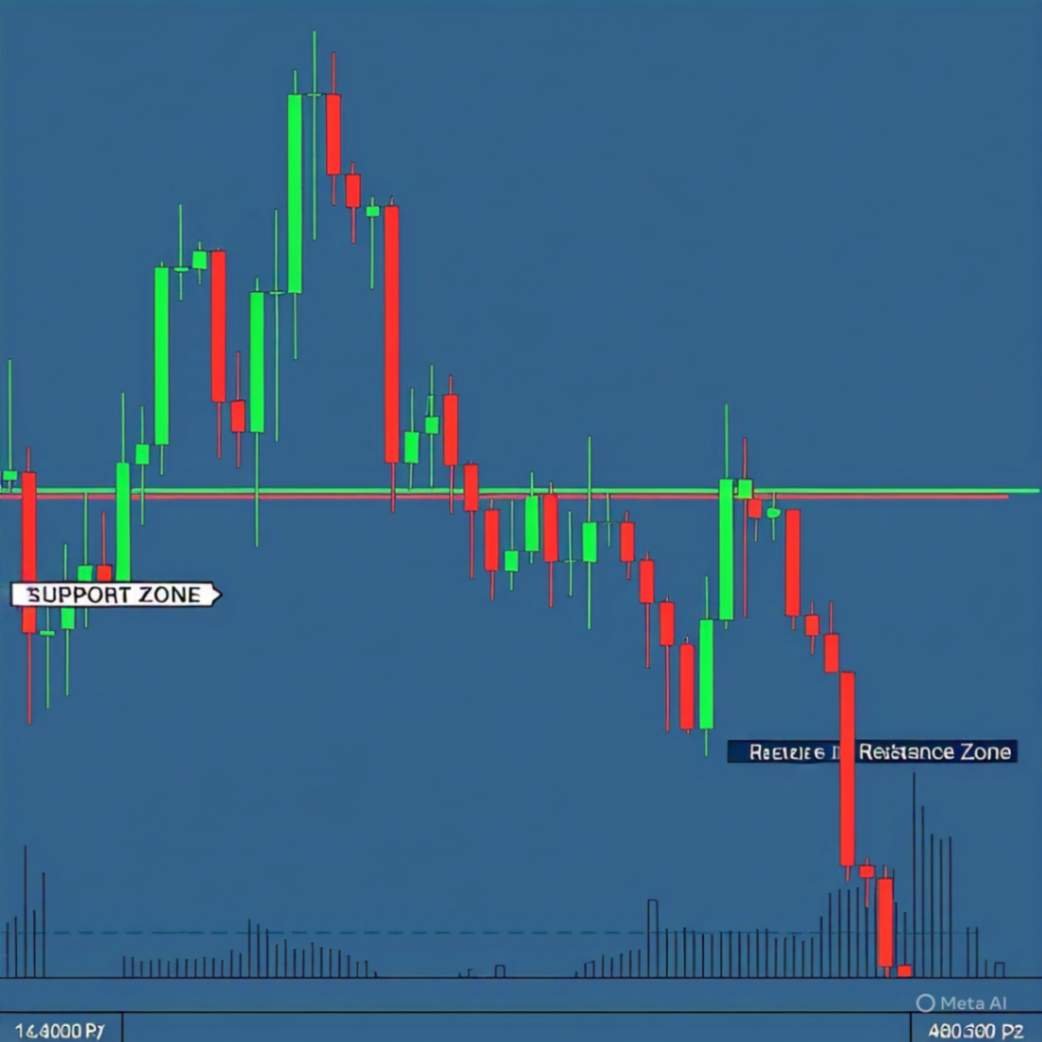
Support and resistance levels are key concepts in stock charts for beginners. ‘Support‘ is the price level where the stock price stops falling as buyers enter. ‘Resistance‘ is the level where the price stops rising as sellers become active. Learning stock chart basics helps you understand that these levels are identified by past price movements. Mark them on the chart with horizontal lines. A breakout (above resistance) or a breakdown (below support) gives strong signals. By understanding these levels in stock charts for beginners, you can decide on the entry and exit points.
Candlestick Patterns for Beginners
Now we know that candlestick patterns are the best way to understand price action in stock charts for beginners. Learning stock chart basics will help you learn simple candlestick patterns. Some common patterns are: ‘Doji’ (open and close price are the same, indicating a decision), ‘Hammer’ (bullish reversal, long shadow below), and Shooting Star (bearish reversal, long shadow above). These patterns indicate the mood of the market—bullish or bearish. Candlesticks should be seen along with volume so that the signal is strong. By practicing these patterns in stock charts for beginners, you can spot trends and reversals, which will help you make better trading decisions.
Tips to Master Stock Charts for Beginners
Mastering stock charts for beginners is essential to understanding market trends and making smart trading decisions. Follow these tips to learn stock chart basics:
1. Start simple: Look for line charts or basic candlestick patterns (like doji, hammer) first so that price movements are clear.
2. Understand Key Elements: Study price and time axes, volume, and support/resistance levels carefully.
3. Use Indicators: Simple indicators like moving averages or RSI help understand trends and momentum.
4. Regular Practice: Watch charts daily and build confidence by identifying patterns like triangles or double tops.
5. Try Paper Trading: Make virtual trades on charts without investing real money to improve your skills.
6. Stay Updated: Market news and events have an impact on charts, so follow current events.
For beginners, patience and discipline are required to master stock charts. Start with small steps and gradually learn advanced techniques. With consistent practice, you can understand market behavior better and make profitable decisions.
Common Mistakes When Reading Stock Charts for Beginners
It is common to make mistakes while reading stock charts for beginners, but by avoiding them, you can become a better trader. Avoid these common mistakes to learn stock chart basics:
1. Overcomplicating Charts: Beginners often use too many indicators or complex patterns, which creates confusion. Start with simple line or candlestick charts.
2. Ignoring Volume: Volume indicates the strength of price movements, but beginners miss it.
3. Short-Term Focus: Looking only at small timeframes (like 1-minute charts) can lead to missing long-term trends. Also, check daily or weekly charts.
4. Trading without Confirmation: It is risky to trade quickly after seeing a pattern. Always seek confirmation from volume or indicators.
5. Ignoring Market News: Along with charts, watch news and events as they affect price movements.
6. Overtrading: Trading on every pattern can lead to losses. Focus only on strong signals.
Stock charts for beginners Patience and practice are important while reading. By learning from these mistakes and adopting a disciplined approach, you can improve your chart-reading skills and make confident trading decisions.
CONCLUSION
Stock charts for beginners are essential tools for navigating the stock market with confidence. By mastering stock chart basics, beginners can decode price movements, identify trends, and make informed trading decisions. From understanding key components like price and time axes to recognizing patterns such as head and shoulders or candlestick formations, stock charts provide a visual roadmap to market behavior. Volume, support, and resistance levels further enhance analysis, helping beginners spot opportunities and manage risks. By starting with simple charts, practicing regularly, and avoiding common mistakes like overcomplicating or ignoring volume, beginners can build a strong foundation in technical analysis. With patience and consistent learning, stock charts for beginners empower new investors to develop strategic skills, improve trading outcomes, and thrive in the dynamic world of stock trading.
FAQs
1. What are stock charts for beginners?
Stock charts for beginners are visual tools that display a stock’s price movements over time, helping new investors track performance, spot trends, and make informed decisions.
2. Why is it important to learn stock chart basics?
Learning stock chart basics helps beginners understand market trends, identify patterns, and predict price movements, enabling smarter trading and investment choices.
3. What are the common types of stock charts?
Common types include line charts, which show closing prices, and candlestick charts, which display detailed price action (open, close, high, low).
4. How can beginners spot trends in stock charts?
Beginners can spot trends by analyzing price movements, candlestick patterns, and volume. Uptrends show higher highs, while downtrends show lower lows.
5. What mistakes should beginners avoid when reading stock charts?
Avoid overcomplicating charts, ignoring volume, focusing only on short-term data, trading without confirmation, and neglecting market news.
6. How can beginners master stock charts?
Start with simple charts, practice regularly, use basic indicators like moving averages, and try paper trading to build confidence and skills.